Choosing a health plan with a simulation: premiums, deductibles, and the bad-year cost
Every open enrollment season, millions of people pick a health plan by looking at the premium and maybe the deductible. That's like choosing a car by its paint color. What matters is your total cost for the year: premiums, plus what you pay when you use care, minus any money your employer puts into an HSA. That total depends on how much care you use, which you don't know in advance.
This post models that in Python. We'll write a cost function for a plan, plot it across spending levels to find the break-even points, then run a simple Monte Carlo simulation to see each plan's average year and bad year. The three plans are hypothetical but have realistic structures.

The three plans
| Plan A (PPO) | Plan B (HSA-eligible) | Plan C (low deductible) | |
|---|---|---|---|
| Your premium per year | $2,160 | $720 | $3,840 |
| Deductible | $1,500 | $3,400 | $500 |
| Coinsurance after deductible | 20% | 20% | 10% |
| Out-of-pocket maximum | $5,000 | $7,500 | $3,000 |
| Employer HSA contribution | — | $500 | — |
To keep the model readable, everything you pay counts toward the deductible and the out-of-pocket maximum, and there are no flat copays. Real plans have copays for office visits and prescriptions, which you can add later.
The cost function
For a year with s dollars of allowed charges (the negotiated amount, not the list price):
- You pay everything up to the deductible.
- Above the deductible, you pay the coinsurance percentage.
- Your share is capped at the out-of-pocket maximum.
- Add the premium and subtract any employer HSA money.
import numpy as np

def annual_cost(premium, deductible, coins, oop_max, hsa, spend):
    spend = np.asarray(spend, dtype=float)
    oop = np.where(spend <= deductible,
                   spend,
                   deductible + coins * (spend - deductible))
    oop = np.minimum(oop, oop_max)
    return premium + oop - hsa

plans = {
    "A": (2160, 1500, 0.20, 5000, 0),
    "B": (720, 3400, 0.20, 7500, 500),
    "C": (3840, 500, 0.10, 3000, 0),
}
for s in (0, 1200, 6000, 20000, 50000):
    print(s, {k: round(float(annual_cost(*p, s))) for k, p in plans.items()})
| Allowed spending | Plan A | Plan B | Plan C |
|---|---|---|---|
| $0 | $2,160 | $220 | $3,840 |
| $1,200 | $3,360 | $1,420 | $4,410 |
| $6,000 | $4,560 | $4,140 | $4,890 |
| $20,000 | $7,160 | $6,940 | $6,290 |
| $50,000 | $7,160 | $7,720 | $6,840 |
The worst case for each plan is the premium plus the out-of-pocket maximum minus the HSA money: $7,160 for A, $7,720 for B, and $6,840 for C.
Break-even points
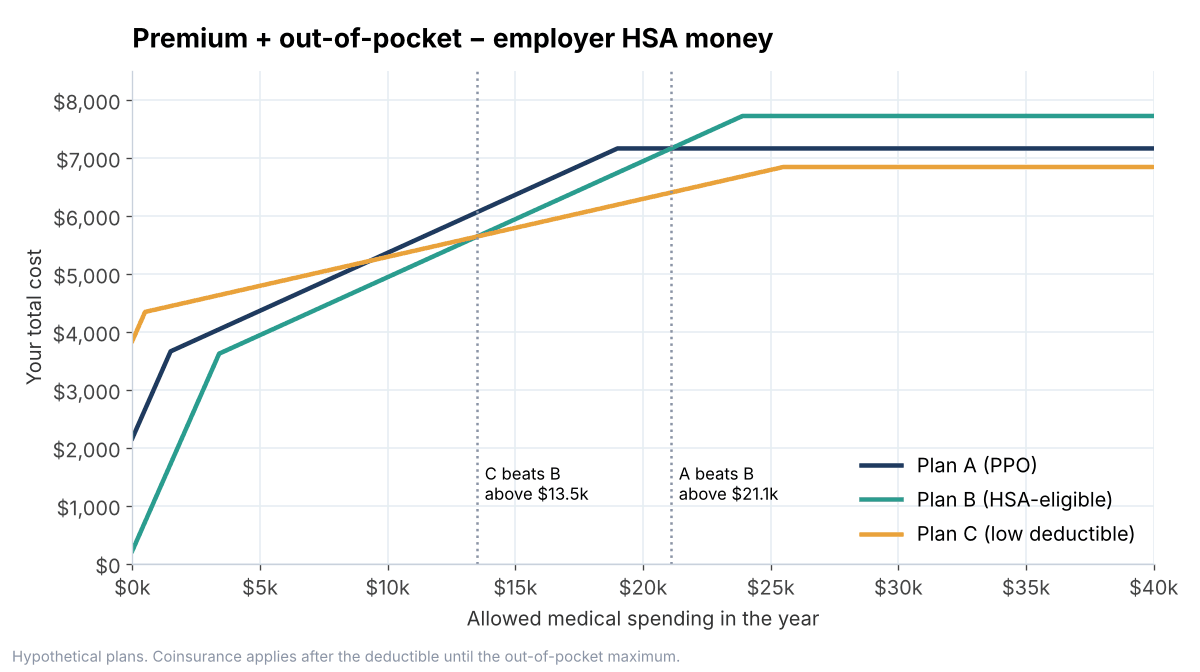
Plot the cost across spending levels and the picture is clear:
To find the crossover points numerically, evaluate on a fine grid and look for sign changes:
xs = np.linspace(0, 60_000, 60_001)
def crossings(a, b):
    d = annual_cost(*plans[a], xs) - annual_cost(*plans[b], xs)
    return xs[np.where(np.diff(np.sign(d)) != 0)[0]]

print(crossings("B", "C"))  # ~13,500
print(crossings("A", "C"))  # ~9,300
print(crossings("A", "B"))  # ~21,100
Plan A is beaten by B below $21,100 and by C above $9,300, so in this set it's never the cheapest at any spending level. That happens more often than you'd think. A plan in the middle of a menu can be dominated by the two around it.
Simulating a year of spending
Health spending is extremely skewed. Most people spend little in a given year, and a few spend a lot. A lognormal distribution is a reasonable first approximation. Here we use a median of $1,200 and a spread wide enough that about 1 year in 100 exceeds $24,700.
rng = np.random.default_rng(7)
spend = rng.lognormal(mean=np.log(1200), sigma=1.3, size=200_000)
print(np.percentile(spend, [50, 90, 99]).round())  # [1200. 6353. 24700.]
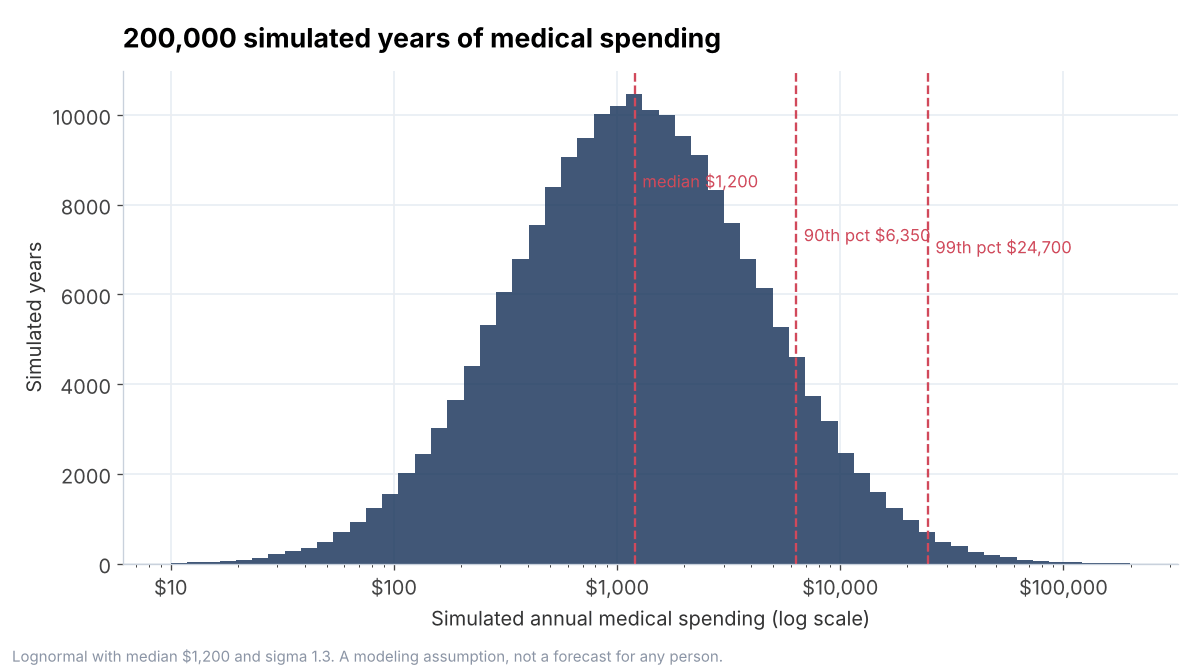
This distribution is an assumption, not a forecast. Someone with a chronic condition, a planned surgery, or a baby on the way should shift it far to the right, or skip the simulation and use a known spending figure.
Average year vs. bad year
for name, p in plans.items():
    c = annual_cost(*p, spend)
    best = np.argmin(np.vstack([annual_cost(*q, spend) for q in plans.values()]), axis=0)
    print(name, round(c.mean()), np.percentile(c, [50, 90, 99]).round())
| Plan A | Plan B | Plan C | |
|---|---|---|---|
| Average year | $3,477 | $2,007 | $4,501 |
| Median year | $3,360 | $1,420 | $4,410 |
| Bad year (90th percentile) | $4,631 | $4,211 | $4,925 |
| Very bad year (99th percentile) | $7,160 | $7,720 | $6,760 |
| Cheapest plan in | 0% of years | 97% of years | 3% of years |
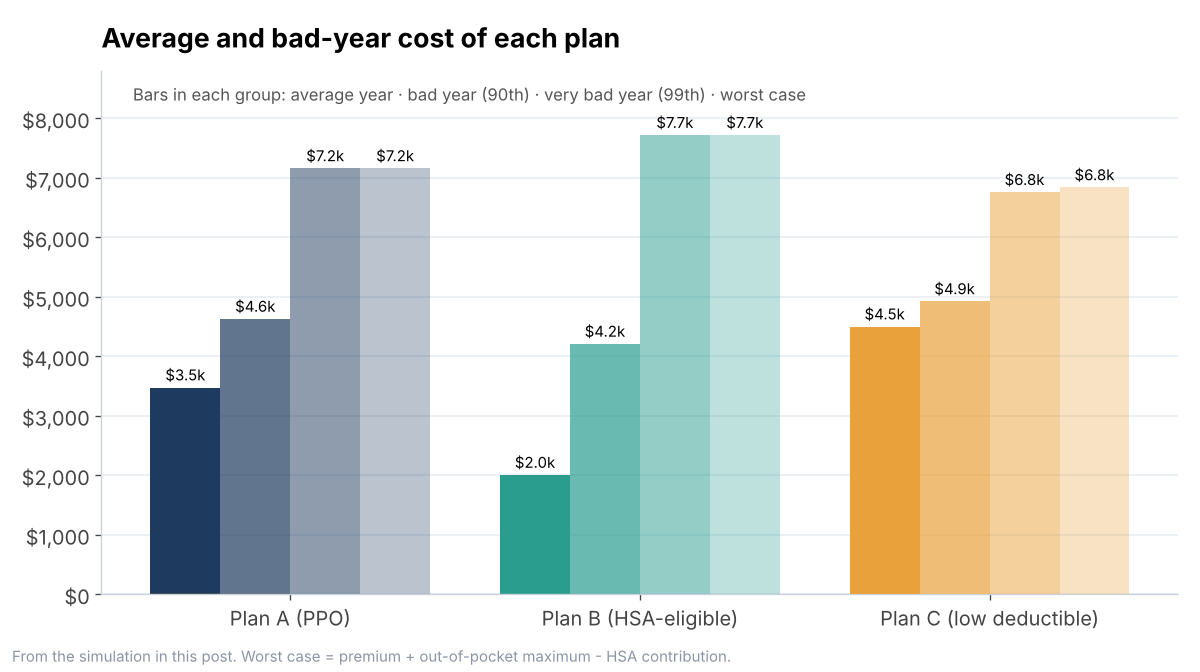
Plan B saves around $1,470 a year on average compared with Plan A and about $2,500 compared with Plan C. In the very worst years it costs up to $880 more than Plan C. For most people who can cover a $7,720 worst case from savings, that trade is easily worth it.
What the simple model leaves out

- Tax savings on HSA contributions. Money you put in an HSA through payroll is usually free of income tax and payroll tax. At a 30% combined rate, contributing $2,000 saves about $600 a year, which tilts things further toward Plan B. See the IRS rules on HSAs for current limits.
- Copays. Many PPO-style plans charge flat copays for office visits and drugs that don't wait for the deductible. Add them as a separate term.
- Networks. Allowed charges are only for in-network care. Out-of-network bills can have a separate deductible, separate maximum, or no cap at all.
- Prescriptions. If you take an expensive brand-name drug, model its cost under each plan's drug tiers explicitly. It can dominate the comparison.
- Family coverage. Family plans have an embedded individual deductible and a family deductible. Model each person, then apply the family limits.
- Cash flow. A high deductible is fine on average but can strain a budget in the month the bill arrives. If you couldn't pay $3,400 quickly, that's a real cost.
Making it yours
- Pull your last two or three years of explanation-of-benefits statements and add up allowed charges.
- Set the lognormal median near your typical year, or use a fixed spending number if you expect a specific procedure.
- Plug in your plans' real premiums, deductibles, coinsurance, maximums, and employer contributions.
- Run the break-even and simulation code above.
- Pick the plan with the best average cost whose worst case you can afford.
Frequently asked questions
Why does Plan B cost $220 when I spend nothing? Premium $720 minus the $500 employer HSA contribution. The HSA money is yours to keep even if you leave the job.
Is the out-of-pocket maximum really the most I can pay? For covered, in-network care, yes, plus premiums. Out-of-network care and non-covered services may not count toward it.
Should I always pick the HSA plan? Not always. If you expect high spending every year, a low-deductible plan with a lower maximum can be cheaper. Run the numbers with your own spending.
Sources and further reading
- HealthCare.gov: How to pick a health insurance plan
- IRS: Publication 969, Health Savings Accounts and other tax-favored health plans
- NumPy documentation: Random sampling
Hypothetical plans and a modeling assumption about spending. General information only, not medical, tax, or insurance advice.